Factors Influencing Ore Recovery and Unplanned Dilution in Sublevel Open Stopes. Case study of Shaft No.4 at Konkola Mine, Zambia
Kalunga Ngoma1
and Victor Mutambo1
*

http://dx.doi.org/10.12944/CWE.15.Special-Issue1.03
Copy the following to cite this article:
Factors Influencing Ore Recovery and Unplanned Dilution in Sublevel Open Stopes. Case study of Shaft No.4 at Konkola Mine, Zambia. Curr World Environ 2020; Special Issue (Sustainable Mining). DOI:http://dx.doi.org/10.12944/CWE.15.Special-Issue1.03
Copy the following to cite this URL:
Factors Influencing Ore Recovery and Unplanned Dilution in Sublevel Open Stopes. Case study of Shaft No.4 at Konkola Mine, Zambia. Curr World Environ 2020; Special Issue (Sustainable Mining). Available from: https://bit.ly/2MMuCUm
Download article (pdf)
Citation Manager
Publish History

Introduction
Sublevel open stoping (SLOS) is a self-supporting mining method which is widely used in the world. Sublevel open stoping method popularity has grown since 1970 and at the end of the 20th century (Henning, 2007). (Jang, 2014) cited (Austrade, 2013) reported that 70% of underground mines in Australia use sublevel open stoping mining method. Pakalnis et al., 1996 found that 51% of underground mines in Canada use sublevel open stoping method. This mining method is applicable to large, massive or tabular and steeping orebodies surrounded by competent hangingwall and footwall (Hartman, 1987). The main advantages of SLOS are low cost, non-entry stopes, highly mechanization of operations such as drilling, loading, mucking and hauling therefore resulting into high productivities with a small number of personnel. The main disadvantage of SLOS is that it is capital intensive and requires significant development before production can start and usually has high ground vibrations from blasts. Another major disadvantage of sublevel open stoping is that it is associated with high unplanned dilution (Jang, 2014). (Pakalnis , 1986) Surveyed 15 mines using sublevel open stoping and found that 47% of the operations suffered more than 20% dilution. Likewise Henning and Mitri, 2007 reported that approximately 40% of open stoping operations in Canada suffered from 10% to 20% dilution. In Canadian mines, dilution greater than 20% is described as excessive (Pakalnis et al., 1996). Dilution is common to all mining operations and it’s impossible to eliminate. (Butcher, 2000), defines mine dilution as the contamination of ore with barren (or below cutoff grade) waste wall rock. Dilution is a qualitative parameter used by the mine operator for evaluation of the design (Pakalnis, 1986). Ore recovery is defined as the ratio of the number of tonnes of ore drawn against the total amount of or blasted (Clark, 1998). Ore recovery and dilution are dependent on each other therefore achieving a certain recovery entails accepting a certain level of dilution (Clark, 1998). Dilution is classified into two categories called planned and unplanned dilution (Figure 1). Planned dilution is the contamination within the orebody and Unplanned dilution is the contamination of ore by waste material outside the stope limit. The term dilution is synonymous with unplanned wall dilution (Henning and Mitri, 2007). Dilution can be controlled to acceptable levels by implementation of proper mining standards (Butcher, 2000), (Ng’ambi and Mutambo, 2016).
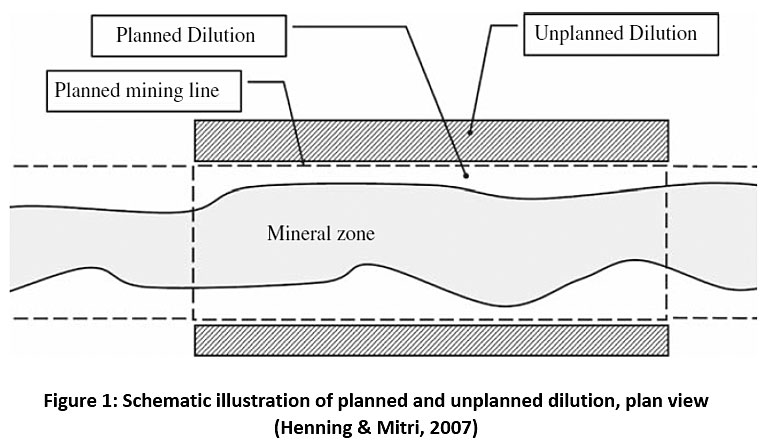 |
Figure 1: Schematic illustration of planned and unplanned dilution, plan view (Henning & Mitri, 2007) Click here to view Figure |
(Pakalnis et al., 1996) Reported that dilution can either be calculated with respect to tonnage or grade. According to Pakalnis, 1986 ten different definitions of dilution were identified during his survey of 22 Canadian mines. The two equations below are the ones that are widely used but (Pakalnis et al., 1996) recommend Equation 1.1 as a standard measure of dilution because it is more sensitive to wall sloughage.
Dilution = (Tons waste mined) / (Tons ore mined) (1.1)
Dilution = (Tons waste mined) / (Tons ore mined + tons waste mined) (1.2)
developed the stability graph. The stability graph method combines information about rock mass strength and structure, the stresses around the opening and size, shape and orientation of the opening to predict stability. Villaescusa, 1998 reported that stope design, geometry, sequencing, drilling and blasting, time, stress environment, undercutting and rock mechanics influence ore recovery and unplanned in sublevel open stopes.
Orebody delineation is the process which establishes the size, shape, grades, tonnage and mineral inventory for the ensuing mining process. Geological discontinuities such as faults, shears, bedding planes, joints, fractures and dykes have low shearing strength and when not oriented unfavourably act as a failure surface (Dominy et al., 1998), (Pelly, 1994 cited by (Henning and Mitri, 2007). Folds usually alter the orientation of bedding planes hence shear stresses are set up between the bedding planes where slip can occur (Brady, 1999). Low rock strength and irregular ore boundaries of the walls of the stope results into high unplanned dilution of the open stope.
Each stope designed should be optimised as a function of local rock mass quality (Diakite, 1998). The geometry of the stope influences the average depth of hangingwall relaxation zone, (Pakalnis et al., 1996), (Hughes, 2011), (Mouhabbis, 2013). The smaller the dip angle of the stope the more hangingwall slough and the steeper the dip angle the lower the hangingwall slough (Mouhabbis, 2013). (Villaescusa, 2000) States that in sublevel open stoping, stability is achieved by having high vertical and short horizontal dimensions, or low horizontal and short vertical dimensions.
According to (Uril, 2015) from geotechnical engineering perspective, undercuts act as free faces that reduce confinement and remove the hangingwall abutments as shown in Figure 2. Therefore, undercuts increase the zone of stress relaxation. (Villaescusa, 1998) suggested that perimeter blasting techniques can be used to reduce stope wall damage in development access hence minimising stope wall undercut.
 |
Figure 2: Influence of wall undercutting on stope relaxation Wang et al., (as cited in Mouhabbis, 2013) Click here to view Figure |
According to (Hoek and Brown, 1980) the stand-up time is defined as “the length of time which an underground opening will stand unsupported after excavation. The better the ground conditions the longer the stand-up time and vice versa. (Ran,2002) cited in (Uril, 2015) and (Mouhabbis, 2013) conducted a study on open stopes where surveys were done and a comparison with the original stope and the unplanned dilution number kept on increasing with time as shown in Figure 3.
 |
Figure 3: Open stope caving (Ran 2002) from Mouhabbis, 2013 Click here to view Figure |
(Henning and Mitri, 2007) observed that when a stope is excavated principal insitu stresses are rotated such that major principal stress (σ1) and intermediate principal stress (σ2) are aligned parallel to the hangingwall but minor principal stress (σ3) aligns perpendicular to the stope hangingwall as illustrated in Figure 4.
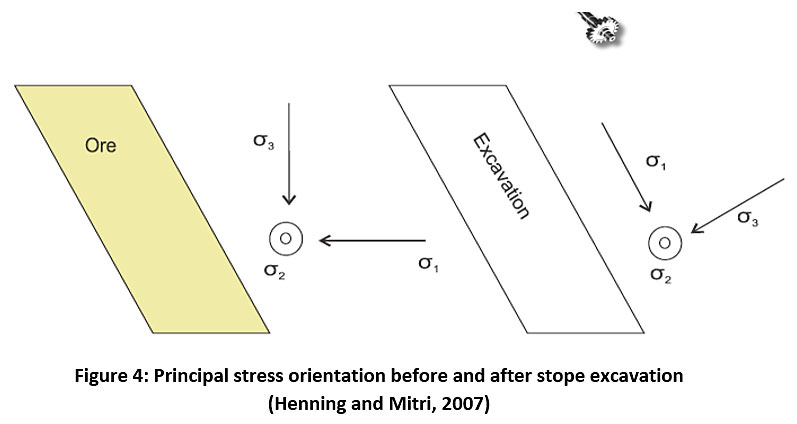 |
Figure 4: Principal stress orientation before and after stope excavation (Henning and Mitri, 2007) Click here to view Figure |
Hangingwall sloughage occurs when the confinement of the minor principle stress is (σ3≤0) and the zone of stress relaxation reduces the clamping forces which are supposed to prevent sloughing of the stope walls (Henning and Mitri, 2007). When induced stress is higher than the shear strength of the rock mass around the stope, localized failures will occur following discontinuities or direct through intact rock resulting into dilution(Dominy et at., 1998), (Hughes, 2011).
Mucking errors such as tipping waste rock into an ore pass is another identified source of dilution (Mubita, 2005). Other factors that may influence ore recovery and unplanned dilution during the mucking process include: ability for the scoop operator to sort ore and waste, rate at which stope is being mucked, presence or absence of a Geologist to assist with grade control, stope size and shape, wall slough and remote mucking (Clark, 1998).
Stope sequencing is key for achieving safe and economic production throughout the stope life (Villaescusa, 2003). In sublevel open stoping mining method, stopes are surrounded by rock on both sides (Mouhabbis, 2013). The primary stope is subjected to very high stresses because of the confinement which tends to distress the adjacent rock mass,(Mouhabbis, 2013). Stope over break occurrence is dependent on the location of the stope within the mining sequence. Figure 5 shows three stope categories for primary stopes (Type P1, P2 and P3) and two secondary-type stopes (Type S1 and S2). Type P1 stope refers to an isolated primary stope, with rock on both side walls, while Type P2 stope is a primary stope which is located above a backfilled P1-type stope. Lastly, Type P3 stope is a primary stope, located above a backfilled P2-type stope, with rock on both side walls. (Henning and Mitri, 2007) demonstrated that primary stopes (P1) have less hangingwall sloughage compared to secondary stopes (S2). While (Hughes, 2011) found that secondary stopes have low overbreak compared to primary stopes based on a study conducted at Lapa mine in Canada and this could be influenced by mining methods and different insitu stress conditions.
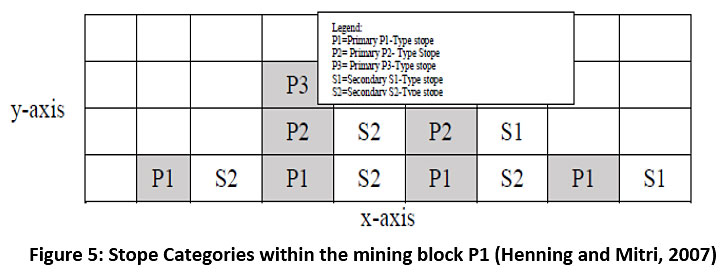 |
Figure 5: Stope Categories within the mining block P1 (Henning and Mitri, 2007) Click here to view Figure |
When backfill is not being used, sequencing of stope extraction becomes a major area of concern in order to prevent the permanent pillars from overstressing early. This is achieved by mining the orebody from the centre towards the abutments and this gradually push the induced stresses towards abutments.
Poor drilling of longholes near the footwall and hangingwall highly influences unplanned dilution in sublevel open stopes. Drilling inaccuracy causes poor blasts with higher vibrations which result in wider muck distribution causing higher stope wall damage and dilution. The following are the causes of drilling inaccuracy: Inaccurate placement of drill reference marks, incorrect drill set-up, limitations of the drilling equipment, condition of the drilling equipment and inconsistent drill operation (Tommilla, 2014). Drilling accuracy should be checked regularly by surveying the collars and breakthrough location of blastholes. Blastholes with very high deviations should be re-drilled before the drill rig moves out of the area and before blasting crew move in to charge the blastholes. Powder factor and geometry of blasting plans are other main factors of blasting influencing unplanned dilution (Jang et al., 2014) and (Wang, 2004). Low energy explosives and perimeter holes must be used for blasting blastholes near hangingwall in order to reduce wall damage due to vibration.
The behaviour of stope walls is dependent on the strength of the surrounding rock mass which also depends on the geometrical nature and strength of the geological discontinuities and rock material (Villaescusa, 2000).
Factors influencing ore recovery and unplanned dilution and at Number 4 Shaft, Konkola Copper Mine
Konkola Copper Mine is located in Chililabombwe District in Zambia as shown in Figure 6. The mine plans to ramp up its annual ore production from 2Mtpa of ore per annum to 6 million metric tonnes of ore in the next five years. This being the case, Shaft Number 3 and Shaft Number 4 have been given a target of 3Mtpa. In order for Number 4 shaft to remain viable ore recovery has to be maximised from 70% to (≥85%) recovery and unplanned dilution to be minimised from 20% to (≤10%) in sublevel open stopes.
Geology of Konkola Mine
The orebody is generally stratiform and predominantly strikes South East –North West and dips at angle between 50o to 70o. The dip of the orebody reduces on the northern side. Sedimentary deposition and metamorphosed rocks are the most predominant rocks generally categorised in the Katanga system. The average true thickness of the orebody is 9m and strike length is 11km. Above the 720m level, a barren gap exists between Shaft Number 3 and Shaft Number 4 and the rocks do not bear any mineralisation. Shaft Number 4 orebody extends from 3000mN to 860mS on the south. The major fault at Number 4 shaft is the Luansobe fault and minor Kakosa fault to the south of the orebody. The fault zone at 2270mN dips at 60 degrees to the south but at 2700mN the fault dips at 85 degrees as well. The faults at 2270mN and 2700mN are on the footwall side of the orebody. Both faults are vertical towards the surface. Minor faults at Number 4 shaft occurs at 2250mN and 2750mN area with a maximum throw of 15.0m and gouge infill of 8cm thick. The effect of the fault extends 20m in either side of the fault zone. In the footwall the displacement ranges between 15 to 20 m but the effect is not significant. The ore body has minor folding around 300mS position. The orebody is mainly sulphide and the most dominant minerals are chalcopyrite, bornite and malachite. Dolomitic shales are found just above the orebody and in some places it is completely kaolinised and decomposed (1200mN to the south) with bands of quartzites and sandstones. The orebody is structurally divided into five units. Banded dolomitic calcareous sandstone is found at the bottom of the orebody and in places which are highly weathered to brown micaceous clay, ‘A’ unit varies in width between 0.3m to 1.0m and rock mass rating varies between 21-40. The B unit is above the A unit width varies between 1.0 to 1.5m. The C and D units of inter bedded strong siltstone and dolomite bands lie below the strong siliceous ‘E’ unit in which the Assay hangingwall usually lies. The hangingwall is made up of quartzite and dolomitic sandstone bands in which in some places are completely kaolinised hence influencing hangingwall instability. Figure 5 shows location of the Konkola mine on the Geological map of Zambian Copperbelt.
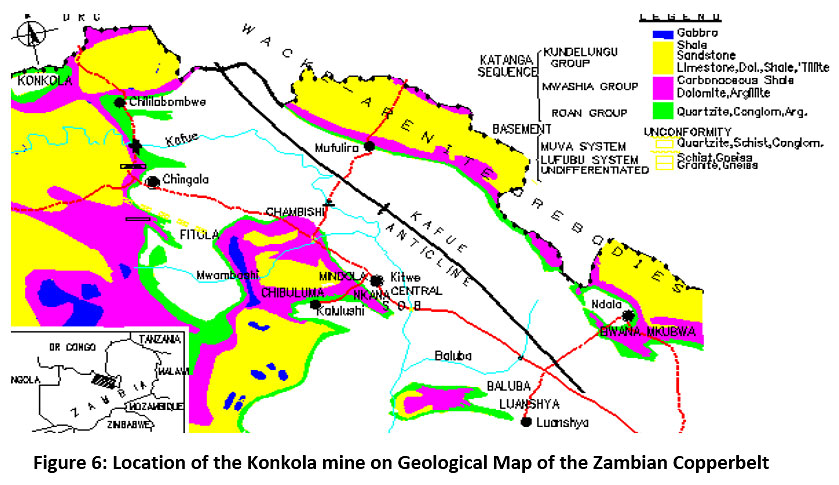 |
Figure 6: Location of the Konkola mine on Geological Map of the Zambian Copperbelt Click here to view Figure |
Materials and Methods
In order to achieve the objective of the research, Literature review on stope designs and parameters that influence low recovery and high unplanned dilution at Number 4 Shaft was done. Data from mine production reports was also reviewed. Field observations and investigations to obtain rockmass properties were done. Empirical analysis using Modified Stability Graph was used to assess the stability of open stopes and Numerical modelling was conducted using PHASE2 software in order to assess failure.
Geological Discontinuities
The fault zone at 2270mN dips at 60 degrees to the south but at 2700mN the fault dips at 85 degrees as well. The faults at 2270mN and 2700mN are on the footwall side of the orebody. Mining of these blocks start from fault zone area advancing outwards in order to prevent creation closures which may result in worse ground conditions that are difficult to mine. The minor faults are associated with increasing joints and leaching. The stope wall sloughage causes an increase in unplanned dilution and low stope recovery in sublevel open stopes. There are three main joint sets and other minor joint sets at Number 4 shaft. The joints usually occur as sets and each has a different dip, dip direction and vary in spacing and joint conditions as shown in Table 1. Stope wall instability is usually as a result of formation of unstable wedges and blocks in the stope walls due to combination of other discontinuities such as fault planes, fissures, and bedding planes, as shown in Figure 7. The orebody is heavily bedded and heavily weathered. Individual planes are dominant features. True bedding plane spacing ranges between a few centimetres and one metre.
Table 1: Joint sets and bedding planes in different locations at Number 4 Shaft
|
Position |
Rock Type |
Joint Sets |
Dip |
Dip Direction |
|
2700mN |
Ore Shale (OS) |
Bed |
41 |
222 |
|
J1 |
51 |
60 |
||
|
J2 |
77 |
73 |
||
|
J3 |
80 |
334 |
||
|
300mS |
Ore Shale(OS) |
Bed |
53 |
27 |
|
J1 |
59 |
87 |
||
|
J2 |
75 |
32 |
||
|
2700mN |
Footwall Quartzite(FWQ) |
Bed |
35 |
235 |
|
J1 |
54 |
50 |
||
|
J2 |
80 |
50 |
||
|
2500mN |
Footwall Quartzite (FWQ) |
Bed |
35 |
213 |
|
J1 |
50 |
65 |
||
|
J2 |
89 |
234 |
||
|
2700mN |
Footwall Sandstone (FWSST) |
Bed |
35 |
245 |
|
|
|
J1 |
40 |
70 |
|
|
|
J2 |
85 |
300 |
|
|
|
J3 |
76 |
65 |
 |
Figure 7: Illustration of failure mechanism due to geological discontinuities 2110mN at 985mL trough drive Click here to view Figure |
The seismic events experienced on the south of the orebody between 500mS and 750mS have resulted into face bursts & shakedown events and no major pillar failures. Most of these failures occur in the footwall drive, trough drive and hangingwall drive and as a result unplanned dilution is increased in the stope. Footwall development should be ahead of the trough drive in order to give geologists ample time to properly delineate the orebody in order to control unplanned dilution. The rockmass rating for oreshale is very poor to fair (Table 2) while that for hangingwall quartzite is between fair to very good. In some areas the hangingwall is heavily fractured,weathered and jointed and the rockmass rating (RMR) is less than 25 (very poor). Once the hangingwall is damaged by blasting due to over drilling or poor secondary development sloughage is induced upto the end of the stope life (Mubita, 2005). In order to prevent hangingwall dilution a 1m skin pillar is left unmined just below assay hangingwall.The maximum hangingwall overbreak sloughing has been in the range of 0.5m to 1.7m due to presence of friable kaolinised bands. At the base of the oreshale is the A unit which has a very poor rockmass rating of 25, highly weathered, highly jointed kaolinised. The A unit is 0.5 to 2.0m thick and it is unminerlised in certain areas hence influencing footwall dilution into the stope. Due to the poor rockmass rating for the ore shale and hangingwall, ore dilution, brow instability and low recovery are introduced into the stope.
Table 2: Descriptions of the rock mass formations at Konkola mine (KCM reports, 2015)
|
Formation |
General Descriptions |
RMR Range |
UCS (MPa) Range |
Average width (m) |
|
Footwall Quartzite (FWQ) |
Very strong, few joints, fresh to slightly weathered, competent ground |
80-90 |
148-55 |
320-400 |
|
Argillaceous Sandstone (AGSST) |
Hard with numerous rough and smooth joints, competent rock, intercepted in some portions with weak kaolin bands. |
61-70 |
80-200 |
45-70 |
|
Porous Conglomerate (PC) |
Poorly to fairly grained, moderately consolidated, moderately jointed, slightly to moderately weathered. |
35-50 |
2-240 |
5-15 |
|
Footwall Sandstone (FWSST) |
Hard with numerous rough and smooth joints, competent rock |
61-70 |
61-478 |
10-15 |
|
Footwall Conglomerate (FWC) |
Coarse grained, poorly consolidated, moderately jointed, and slight to moderately weathered. |
45-70 |
14-353 |
5-12 |
|
Ore shale (OS) |
Hard, moderately jointed, thin to thickly bedding with kaolin infill in some portions. |
25-50 |
20-399 |
5-20 |
|
Hangingwall (HWQ) |
Formation of quartzite and dolomitic sandstone bands, which in some places completely kaolinised. |
45-75 |
59-307 |
30-150 |
Drilling and Blasting
Explosive distribution is controlled by several drilling and blasting parameters such as drill hole size, drill hole spacing and burden, charging geometry and the drill hole accuracy (drill hole deviation). Some blastholes are not drilled to full length and this causes ore losses and hangups which is not safe for working personnel and equipment. The ring burden used is 2m and toe burden is 3.1m. The stemming length ranges between 0.5m to 1m. Some drill rigs used at the mine do not have stingers. This causes hole deviation which in turn influences unplanned dilution because waste is blasted. The powder factor for stope ranges between 0.3kg/tonne to 0.45 kg/tonne. Inaccurate drilling coupled with poor charging practices are one of the main cause of low recovery and high unplanned dilution at the mine.
Stope Sequencing
The mining sequence used at Number 4 shaft is top to bottom with permanent pillars and no backfill. The direction of mining is longitudinal. The current practice of not following the mining sequence because of extracting high ore grade first significantly influences unplanned dilution and low recovery because of the high stress blocks created within the orebody as shown in Figure 12. (Villaesusa, 2003), reported that stope sequencing is very useful for managing the overall behavior of a rockmass. An optimized stope sequencing reduces cost of development, time of stope mucking, ground support requirements and maximizes ore recovery.
Stope Undercutting
Exposure crosscuts are mined every 30m in order to know the extent of the orebody. Figure 2 illustrates effects of stope undercutting. These undercuts influence hangingwall failure because the rockmass rating is generally fair to poor (25 to 60), and are highly fractured and heavily jointed with the presence of friable kaolinised bands. The dimension of the undercut in the stope is 4.2m by 4.2m.
Stope Geometry
The stope dimension in use is 20 m height, 30m strike length and 8m width. Hydraulic radius is 6m and the dip of the orebody is 45 degrees. Empirical Stability graph analysis was used in order to make informed decisions on the behaviour of the stopes as mining progressed to deep levels. In order to use the stability graph, modified stability number (N’) and the hydraulic radius (HR) are required (Figure 7). The modified stability number measures the quality of the rockmass under a given stress condition while HR represents the dimensions of the stope. Joint sets for different rock formations and individual joint orientations (dip and dip direction) were measured and recorded at Number 4 shaft. Joint set number (Jn), Joint roughness (Jr) and joint alteration number (Ja) were estimated from core logs and underground face mapping. The parameters used for calculating stability number are shown in Table 3 while Table 4 shows summary of stability graph parameters. 2110mN stope at 985mL was reviewed for empirical stability analysis and numerical modelling using PHASE2 software.
Table 3: Parameters used for Calculating Stability Number for 2110mN 985mL on the North
|
Rock Formation |
RQD |
Jn |
Jr |
Ja |
Q’ |
|
HWQ |
75 |
3 |
1.5 |
0.75 |
50 |
|
OS |
52 |
12 |
1 |
1 |
4.2 |
|
FWC |
65 |
6 |
3 |
2 |
16.2 |
|
FWSST |
85 |
12 |
3 |
2 |
10.6 |
Table 4: Summary of Stability Graph Parameters for 2110mN 985mL on the North
|
Rock Formation |
Q’ |
A |
B |
C |
Stability Number N’ |
Hydraulic Radius (HR) |
|
HWQ |
50 |
0.35 |
0.3 |
4.4 |
23.1 |
6 |
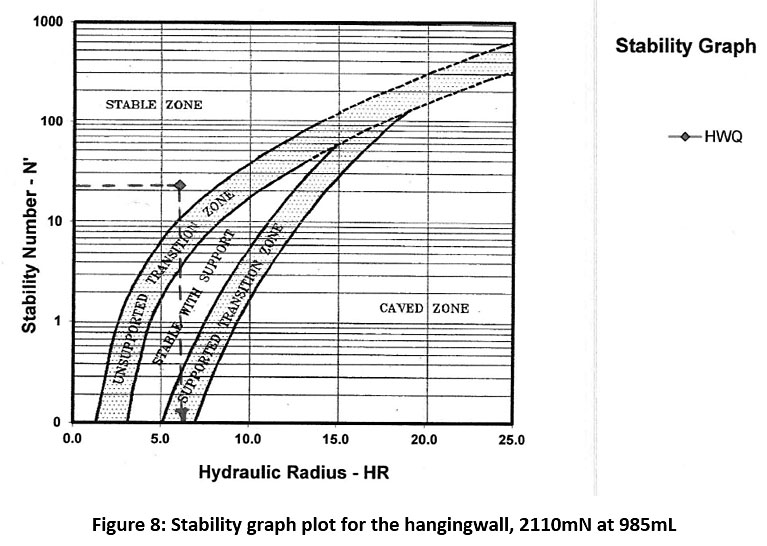 |
Figure 8: Stability graph plot for the hangingwall, 2110mN at 985mL Click here to view Figure |
Modified Stability Number (N’) and Hydraulic radius (HR) show that 2110mN at 985mL stope will be stable on the hangingwall as shown in Figure 8, but in some areas the immediate hangingwall is poor to fair and fair to moderate in some areas associated with friable kaolinised band. Consequently, sloughage of walls will occur.
Time Dependency
Stope life on average is 30 days. No proper monitoring of stope is done at the mine and the stope tonnage ranges from 10000 to 15000 tonnes. The influence of time on stope stability and dilution is dependent on stress redistribution created by nearby excavations (Wang, 2004). Reducing stope exposure time, thoroughly timely mucking after a blast and minimising the mucking time tremendously reduce unplanned dilution. Stope hangingwall and footwall are highly relaxed hence the stope walls are more prone to sloughage due to gravity. Unfortunately, cavity monitoring surveys (CMS) are not conducted at Number 4 shaft. Ore extracted from the stope is compared against the planned volume.
Stope Design
Two sublevels stopes of convenient size are formed with an extraction haulage below. Ore sections are left to support the hanging wall. A rib pillar 4m thick is left between two adjacent stopes in order to support the hangingwall. Crown pillar of 3m thick is left to support mine workings and below the production stopes. Based on site observations, crown pillars usually collapse when half the stope has been extracted hence introducing unplanned dilution. A 2m diameter slot raise is opened up at the boundary of the orebody, and then blastholes are drilled parallel to the slot raise. The rest of the stope is drilled by Solo drill rigs and Simba rigs which drill 76mm diameter blastholes. The blastholes are drilled in the ore drive where the ground condition is competent while in poor ground conditions the blastholes are drilled from the crosscut. The first sublevel is used as a drilling level and the second sublevel is used as an extraction level. By design the stopes have to be blasted in multi lifts but stopes are blasted in single lifts which influence unplanned dilution.
Handling of Material
Lack of remote loaders influence ore losses in sublevel open stoping at Number 4 shaft as reasonable amount of ore remains in the stope. Unplanned dilution also arises during the mucking process due to lack of sensitisation to operators on the need to sort ore and waste.
Stress Environment
Table 5: Insitu stresses at Number 4 Shaft
|
Location of stress test |
Value MPa |
Dip/Direction (Degrees) |
|
Major –sigma 1 (σ1) |
39 |
51/121 |
|
Inter-sigma 2 (σ2) |
18 |
17/09 |
|
Minor-Sigma 3 (σ3) |
15 |
34/267 |
|
Bedding plane |
46/215 |
|
Numerical modelling
Numerical modelling is used for prediction of stress, strains and displacements. PHASE2 is a two dimensional (2-D) software elasto plastic used for modelling stopes at Number 4 Shaft. First stress state around the excavation was determined and then a failure criterion was applied to the rock mass in order to establish if the modelled stress would induce failure. Table 6 shows inputs which were used for modelling with PHASE2.
Table 6: Inputs used for modelling with PHASE2.
|
Hoek Brown Classification |
HWQ |
Ore Shale |
FWC |
FWSST |
PC |
AGSST |
|
UCS-Intact (MPa) |
170 |
110 |
130 |
175 |
140 |
135 |
|
GSI |
55 |
35 |
55 |
60 |
50 |
50 |
|
D |
0 |
0 |
0 |
0 |
0 |
0 |
|
mi |
20 |
6 |
21 |
17 |
21 |
17 |
|
mb |
4.009 |
0.589 |
4,210 |
4,074 |
3.511 |
2.851 |
|
s |
0.0067 |
0.0007 |
0,007 |
0.0117 |
0.0039 |
0.0039 |
|
a |
0.504 |
0.516 |
0.504 |
0.503 |
0.506 |
0.506 |
|
E (MPa) |
26000 |
12500 |
18500 |
25000 |
15000 |
11400 |
|
v |
0.2 |
0.2 |
0.2 |
0.2 |
0.2 |
0.2 |
Model Results and Analysis
The sigma1(σ1=39MPa) contours for 2110mN stope at 985mL are high stress is induced around crown pillar, top right corner and left bottom corner of the stope hence influencing stope wall instability. It was observed that 60MPa of induced stress developed at the top right corner and between 45 to 50MPa at the crown pillar and right bottom corner of the stope as shown in Figure 9. Stope hangingwall are in a zone of relaxation or low tensile induced stress. The relaxation leads into unclamping of the key blocks, a situation which can result into tension failure of key blocks thereby introducing unplanned dilution into the stope. Dark blue contours (Figure 9) indicate zone of relaxation.
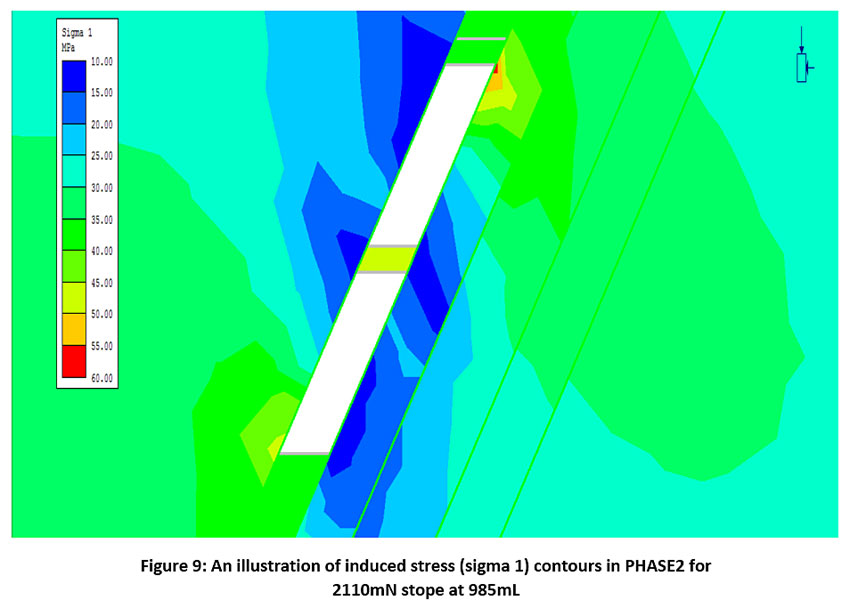 |
Figure 9: An illustration of induced stress (sigma 1) contours in PHASE2 for 2110mN stope at 985mL Click here to view Figure |
Strength Factor
The strength factor contours indicated for 2110mN stope at 985mL in Figure 10 shows that the stope is stable. The strength factor values are less than 1 on the right bottom corner and top left corner of the stope as shown in Figure 10. Strength factors greater than or equal to 1 (one) means the stope wall is stable and failure will not occur while strength factor less than 1 (one) means stope wall are unstable and failure will occur if left unsupported. The low strength factor also indicates high induced stress in these areas of the stope.
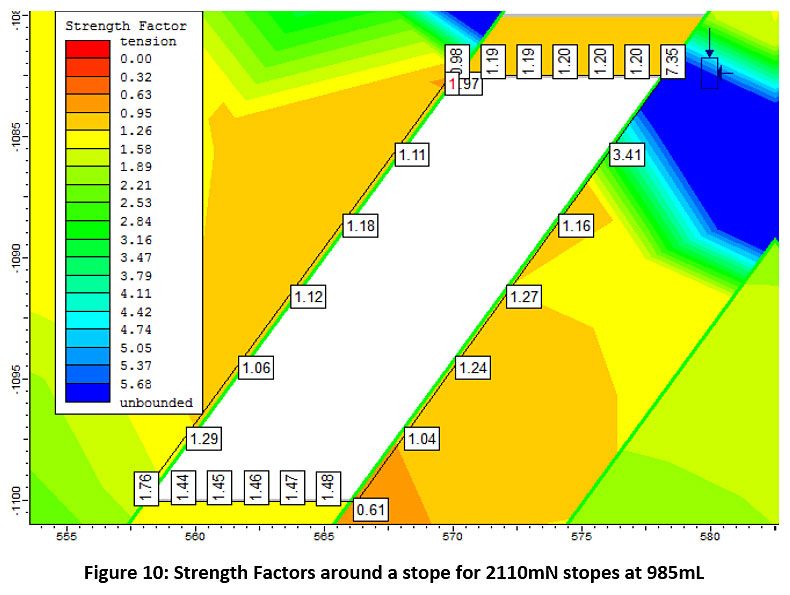 |
Figure 10: Strength Factors around a stope for 2110mN stopes at 985mL Click here to view Figure |
Maximum Total Displacement Analysis
Total displacement analysis shows how 2110mN stope walls respond to the induced stresses. Figure 11 shows that much of the 0.09m displacement takes place on the hangingwall side of the stope. This is in line with KCM Geotechnical Report, 2015 and site observation. However, total displacement does not give an accurate picture of depth of instability on the hangingwall but it helps to understand stope behavior and ground control measures to prevent caving of the stope walls. Mubita, 2005 reported that stopes around 800mN area had hangingwall overbreak greater than 5m
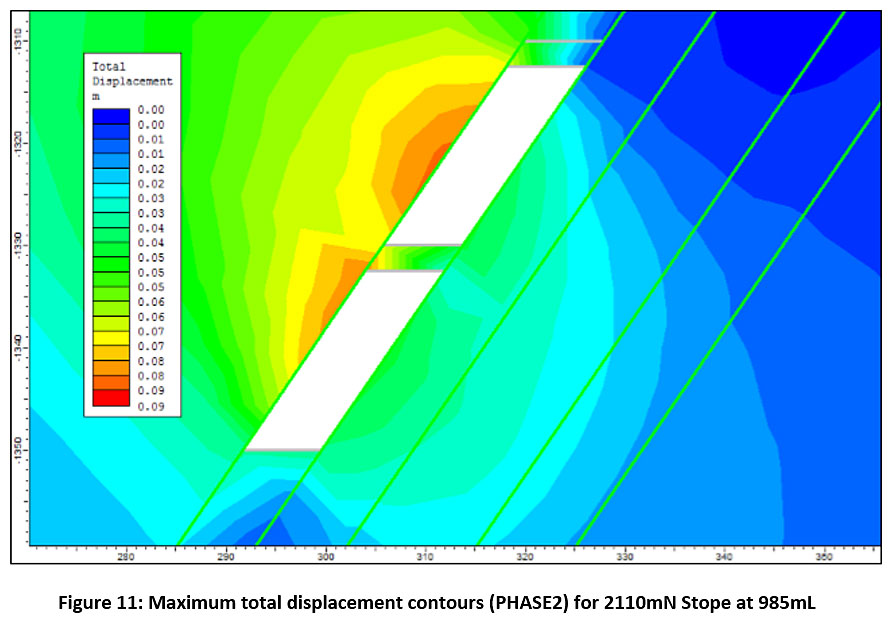 |
Figure 11: Maximum total displacement contours (PHASE2) for 2110mN Stope at 985mL Click here to view Figure |
Figure 12 and Figure 13 shows a trend of recovery factor verses dilution factor and recovery factor verses grade factor for financial year 2018
 |
Figure 12: Recovery factor verses Grade Factor at Number 4 shaft, Konkola Mine. Year 2018 to 2019 Click here to view Figure |
Figure 12 shows stope performance of ore recovery and dilution factors for the year 2018. The average recovery factor is 70% and dilution factor is 20%. Current recovery factor of 70% is way below the optimum planned target of ≥85% and current dilution factor is ≥20%, which is higher than the desired dilution factor of ≤10%. Calculation of recovery is done by comparing the tonnes of ore recovered against the planned tonnage of the stope. Stopes are not surveyed by cavity monitoring scanners or total stations. Figure 13 shows the relationship between grade factor and recovery factor at Shaft No 4. Dilution Factor is the ratio of total tonnes of waste received at the mill divided by the total tonnes of ore received at the mill. Grade Factor (GF) is the ratio of ore grade received at the mill divided by the ore grade of the extracted reserve and unrecoverable ore reserve. The average actual grade factor is 70% against a planned target of 90%. However, Dilution factor at Number 4 shaft is calculated by:
Dilution Factor (DF) = ((1/Grade Factor)-1))*100%
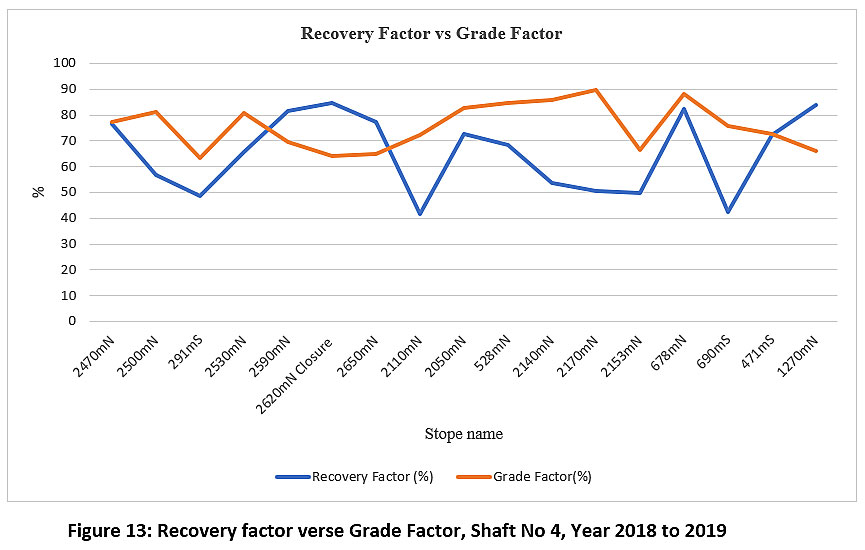 |
Figure 13: Recovery factor verse Grade Factor, Shaft No 4, Year 2018 to 2019 Click here to view Figure |
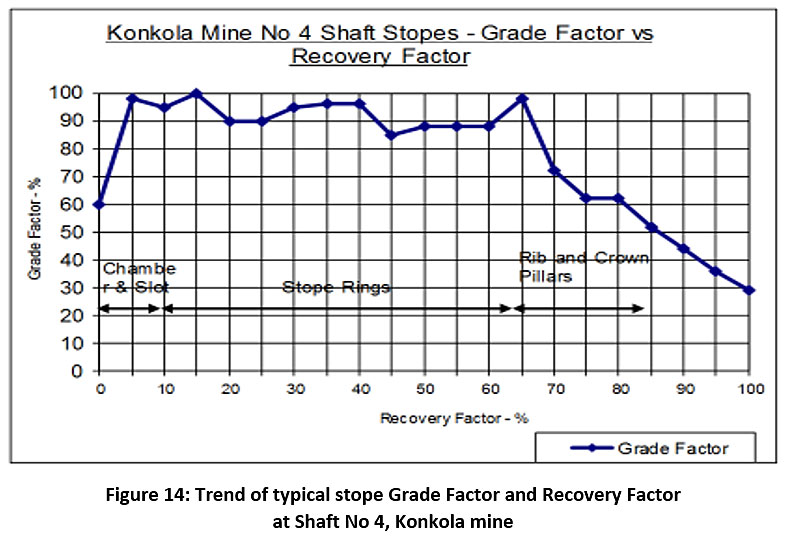 |
Figure 14: Trend of typical stope Grade Factor and Recovery Factor at Shaft No 4, Konkola mine Click here to view Figure |
Figure 14 shows a typical stope life in terms of recovery and grade factor. When production commences, at the slot raise grade factor is around 60% but increases to 90% or more when stope rings are being extracted. However, towards the end of the stope life the extraction increases and the grade factor drops to around 30%. It was also observed that crown pillar collapses when half of the stope strike length has been extracted.
Discussion
The main factors that influence low recovery and unplanned dilution in sublevel open stopes at No. 4 shaft are: (1) Poor ground conditions- The rockmass rating (RMR) for the ground condition is weak to fair (20 to 60) for both hangingwall and footwall. Footwall is associated with A unit which is 0.5m to 1m thick and its rockmass rating is less than 25. The A unit usually sloughs hence influencing unplanned dilution and instability leading to causing low recovery in stopes (Figure 7). Hangingwall dilution is estimated to be 1.5m overbreak and 0.5m overbreak on the footwall side. The joints are spaced between 0.5m and 1.5m and this causes wedge failure on the hangingwall. The current stoping practice of not using backfill at the mine also causes instability and high unplanned dilution as shown in Figure 11. Cemented backfill is required in order to achieve maximum recovery and less dilution (Mutawa, 2011). Cemented backfill and proper support compliance with shotcrete, split sets, welded wire mesh and cable minimise stope wall and A unit from collapsing thereby improving stope recovery and reducing unplanned dilution. Lack of backfill in some stoping areas results into instability, significant waste dilution and oversize material reporting at the draw point cross cuts. (2) Geological discontinuities- The RMR rating for ore shale at Number 4 shaft ranges from 25 to 50 and for hangingwall and footwall ranges from 25 to 60 which represents weak to fair ground conditions. The rockmass is heavily jointed, weathered and kaolinised and has low rockmass strength on the contacts. The rockmass is associated with geological discontinuities such as joints, bedding planes, folds and faults. These discontinuities have low shear strength hence influencing unplanned dilution (Diederichs and Kaiser, 1999) from Henning, 2007. (3) Poor drilling and blasting operations. Poor drilling and blasting practices influence unplanned dilution by sloughing stope walls due to drilling inaccuracy. Inaccurate drilling causes increased toe burden and ring burden hence creating hang ups in the stope. Poor marking of rings and rigging positions contribute to increase inaccurate drilling. Most drill longhole rigs have no stingers and those with stingers operators don’t use them hence influencing hole deviations which cause an increase of toe burdens causing build up and breaching of the hanging wall resulting into unplanned dilution and low recovery. Stope blastholes are not timed so this increases the charge mass per delay thereby increasing the amount of explosive energy been released and this causes high ground vibrations which has resulted into stope wall damage through joints. In order to minimise blast damage of stope walls drilling and blasting parameters such as powder factor, hole diameter and delay timing should be factored in the stope design. (Clark, 1998), reported that blasting practice can increase or decrease unplanned dilution. According to Clark, 1998 delayed mucking and exposure time influence unplanned dilution. In order to minimise hangingwall sloughage, some amount of ore is left in the stope before blasting another ring. The crown pillar is designed to stand until the end of the stope life. However, from site observations, crown pillars usually collapse half way the stope strike length thereby introducing unplanned dilution in the stope. A 1m ore skin is left at the undrilled at the hangingwall in order to minimise waste from reporting into the stope. The 1m skin is usually damaged by blasting because of high charge mass due to lack of initiation timing. Relevant personnel who sign on stope layouts rarely do proper due diligence and each stope is different and unique. (Clark, 1998), and (Wang, 2004) noted that relaxation zone in secondary stopes is more than primary stopes. Therefore, secondary stopes have high unplanned dilution. Most parameters should be incorporated in each particular stope design so that unplanned dilution can be addressed at design stage. In order to reduce dilution and increase ore recovery in sublevel open stoping, stope design requires interactions among geology, mine planning, rock mechanics and operations personnel (Mubita, 2005); (4) Stress environment. In terms of stress environment, numerical modelling show high induced stresses around top stope corner and crown pillar and large displacement on the hangingwall (Figure 11). These stresses increase with mining depth. The major principal stress (σ1) is 39MPa, intermediate stress (σ2) 18 MPa and minor principal stress (σ3) of 15 MPa. When the stope is excavated σ1 and σ2 are rotated and aligned parallel to the stope hangingwall while σ3 is aligned perpendicular to the stope hangingwall as shown in Figure 4. A decrease in σ3 increases the relaxation zone because the clamping forces are reduced hence increasing hangingwall sloughage thereby increasing unplanned dilution. Model results (Figure 9) show high stresses in crown pillars and stope corners. Strength factors of 1 and above means stope wall is stable. Strength factor of 1 means failure will occur. (Wang, 2004), reported that stress concentration in open stopes occur around pillars, hangingwall and footwall. Failure of the stope walls will occur if the induced stress is greater than the strength of the rockmass. In order to reclaim the pillars cemented backfill is required. High seismicity in the southern part of the orebody due to high stresses in the ruminant pillars hence trough drives are not usually mined; (5) Undercutting - Unplanned dilution at the mine also takes place as a result of undercutting. Exposure crosscuts of 4.2mx4.2m are mined at 30m intervals in order to know the extent of the orebody. These crosscuts are sometimes misaligned and cause failure of the hanging wall rockmass which is generally fair to poor (25 to 60), highly fractured and heavily jointed with the presence of friable kaolinised bands. According to hangingwall (Wang, 2014), stope undercutting takes place when the trough drive does not follow the ore/waste contact and moves into the hanging wall. Wang, 2004 also reported that stope undercutting influences unplanned dilution because it increases the relaxation zone thereby causing stope wall instability. (6) Stand up time - Stand up time of the stope walls depend on the ground conditions. The higher the ground conditions the lesser the stope wall sloughage and vice versa. (7) Stope sequencing - The current practice of not following the mining sequence to practice of extracting high ore grade has resulted in the creation of high stress blocks within the orebody thereby influencing unplanned dilution and ore recovery. (Villaesusa, 2003), reported that stope sequencing is very useful for managing the overall behavior of a rockmass. According to (Potvin and Hydima, 2001) lack of proper stope sequencing and economic assessment highly influences unplanned dilution.
Numerical modelling using PHASE2 at 985mL, 2110mN stope indicate that the stope hangingwall are in a zone of relaxation or low tensile induced stress. The relaxation leads to unclamping of the key blocks hence introducing unplanned dilution into the stope. This position is supported by (Hughes, 2011) reported that when a fractured rock mass is in a relaxed state stress zone, the rock blocks separated by discontinuities and the opening walls can unravel and influence dilution.
Conclusion
The following are the major factors influencing unplanned dilution and low recovery at Number 4 Shaft:
- The rockmass rating of the orebody, A unit and hangingwall are poor to fair, leached, weathered and kaolinised. Poor ground conditions result in premature failure of stopes.
- Modified Stability Graph empirical analysis used to assess the stability of open stopes indicates that although some stopes are stable in the hanging wall (2110mN at 985mL stope), others in the immediate location are not stable due to poor to fair hanging wall. Poor hanging wall results in sloughage of walls which in turn results in unplanned dilution and low ore recovery.
- Stress state modelling using Phase 2 software for 2110mN Stope at 985mL has established that the hangingwall is in a zone of relaxation or low tensile induced stress. The relaxation zone is attributed to unclamping of the key blocks resulting in unplanned dilution and low ore recovery into the stope.
- Lack of proper stope sequencing due to the practice of extracting high ore grade first has influenced unplanned dilution and low ore recovery because of the high stress blocks created within the orebody. Poor stope sequencing has resulted into the buildup of stresses in remnant pillars in the southern part of the orebody. The number of seismic events is very high between 500mS and 750mS.
We would like to thank the entire Management and Staff of Konkola Copper mine for allowing this study to be undertaken at the mine site and also for valuable data. We also wish to thank the Dean, School of mines for the help rendered during the collection of information.
Funding
The authors acknowledge partial financial support covering fieldwork from the University of Zambia, School of Mines and declare that there are no competing financial interests to influence the work reported in this paper.
Conflict of Interest
The authors do not have any conflict of interest.
References
- Brady, B. B. H., 1999. Rock mechanics: for underground mining. 2nd ed. Boston: Kluwer Academic Publishers.
- Butcher, R., 2000. Dilution Control in Southern African Mines. Brisbane, Austrlaria, MassMin.
- Clark, L. M., 1998. Minimizing dilution in open stope mining with a focus on stope design and narrow vein longhole blasting, s.l.: Msc. Thesis, University of British Columbia.
- Diakite, O., 1998. Ore Dilution in Sublevel Stoping, s.l.: Thesis. University of MacGill.
- Dominy et, .., 1998. The Nature of Dilution in Narrow Vein Mining. Rotterdam, s.n.
- Hartman, H. L., 1987. Introductory Mining Engineering. 2nd ed. Alabama: John Wiley and Sons.
- Henning and Mitri, 2007. Mine Planning for Ore dilution. Montreal, Canadian Insititute of Mining.
- Henning and Mitri, 2007. Numerical modelling of ore dilution in blasthole stopping. International Journal of Rock Mechanics and Mining Science, 44(1), pp. 692-703.
- Henning, 2007. Evaluation of Long- Hole Mine Design Influence on Unplanned Ore Dillution., s.l.: PhD Thesis, Macgill University.
- Hoek and Brown, 1980. Underground Excavations in Rock. 1st ed. London: Insititute of Mining and Metallurgy.
- Hughes, R., 2011. Factors influencing overbreak in narrow vein longitudinal retreat mining, s.l.: Mc.Gill University.
- Jang, H., 2014. Unplanned Dilution and Ore-LossOptimisation in Underground mines Via Cooperative Neuro Fuzzy Network, Australlia: PhD Thesis, Curtin University.
- Mathews et.al,, 1981. Prediction of stable excavation for mining at depth below 1000 m metres in hard rock., s.l.: Camnet Report.
- Mouhabbis, H., 2013. Effect of Stope Construction Parameters on ore Dilution on Narrow Vein Mining , MacGill: Thesis, MacGill University.
- Mubita, D., 2005. Recent initiatives in reducing dilution at Konkola mine, Zambia. South African Insititute of Mining and Metallurgy, Issue 1, pp. 107-112.
- Mutawa, A., 2011. Geotechnical study on the feasibility of using backfill in steep dip areas of Konkola Copper mines (Zambia), Lusaka: University of Zambia.
- Ngambi, I., Mutambo V., 2016. Optimization of stope recovery and dilution at Mufulira mine through application of appropriate. International journal of applied research. International Journal of Apllied Research, 2(9), pp. 397-402.
- Pakalnis et.,al, 1996. Quantifying the cost of dilution in underground mines. International Journal of Rock Mechanics and Mining Sciences and Geomechanics, 33(5), pp. 1136-1141.
- Pakalnis , R., 1986. Empirical stope design at Ruttan mine, Vancouver: University of British Columbia.
- Potvin and Hydima, 2001. Open stope Mining in Canada. Brisbane, AusIMM.
- Potvin, Y., 1988. Empirical stope design in Canada. PhD Thesis , British Columbia: University of British Columbia.
- Scoble and Moss, 1994. Dilution in underground bulk mining implications for production management, London: Geological Society of London.
- Stewart, P., 2005. Minimising Dilution in Narrow-Vein Mines. PhD Thesis, Queensland: University of Queensland .
- Suorneni, F., Tannant, D.,Kaiser, P.,Desseault, B., 2001. Incorporation of a Fault Factor into the stability Graph Method. Mineral Resources Engineering , 10(1), pp. 3-37.
- Tatman, 2001. Mining dilution in moderate- to narrow-width deposits. Underground Mining Methods: Engineering Fundamentals and International Case Studies. Littleton, USA, Society of Mining Metallurgy and Exploration.
- Uril, V., 2015. Ore-Skin Design to Control Sloughage in Underground Open Stope Mining, Toronto: University of Toronto.
- Villaescusa, 1998. Backfill for bench stoping operations. Brisbane, Australia, 6th Symposium with Backfill, AusIMM.
- Villaescusa, E., 1995. Sources of external dilution in underground sublevel and bench stoping. Brisbane, Australia, AusIMM.
- Villaescusa, E., 2000. A review of Sublevel Stoping. Melbourne, Australia, AusIMM.
- Villaescussa, E., 2004. Quantifying open stope performance. Chile, MassMin, Inst. Ing. .
- Villaesusa, E., 2003. Global Extraction sequences in sublevel stoping. Kalgoorlie, Western Australia, MPES 2003 Conference.
- J., 2004. Influence of stress, undercutting, blasting and time on open stope stability and dilution, Saskatoon, Canada: PhD Thesis. Unversity of Saskatchewan.


